Welcome to another article, this time on when to exit a trade. When beginner traders start looking for that magic "make me a bucket load of cash" trading system, quite often the last thing thought about is their exit strategy. Usually the first and most important thing on a traders mind is when to enter a market, forgetting that you actually make bugger all money if you can't execute and exit as precisely as you entered.
There are three main scenarios that a trader will find themselves thinking of their exit:
At first glance, you would think the easiest scenario of the three to exit under is number 1, i.e. when you are in profit, after all you are "cashing in" so how hard can it be. In fact, in reality all three can be as hard as each other. The reason?, like most things with trading, it comes to emotion. Below I have added the underlying emotions that might stop you closing a trade under these three scenarios:
Let's look at them one by one.
Cannot close a profitable trade (Greed)
Everyone fights greed every day in life, always "wanting" rather than sticking to what you actually "need". It is part of a materialistic modern day culture that most of us are subject to. Trading is no different, and it is usually greed that can turn a nice logical, well planned and profitable trade into a losing one. When this happens, a trader reacts two ways, one, they are distraught at themselves for letting it all get away, or two, they tell themselves "well I was right with my prediction, the market just had it in for me".
Think of this, you set up a trade, monitor the setup closely, wait for the exact time to enter a trade, calculate your stop loss, your order is hit and you are in the trade. The price action moves beautifully, moving quickly towards your scantily thought about target (if you set one), and the sense of delight sends your brain into overdrive, working out the profits, imagining the ferrari soon to be in the drive-way, wondering if 2000 pips has ever been done in one day. This is when you know you are in some trouble, this is when greed has started to set in, you remove your profit target thinking "let's see how long this goes", you don't move your stop loss, cause you don't even contemplate that it might reverse, and you "go for the ride".
A common saying is "cut your losses, and let your profits run" (or something like that ;)), and it is a very good theory that should be followed. However, how do you ride your profits, without risking a reversal that you will undoubtedly put down to "a correction that will soon move back my way".
Personally I look at it this way:
Cannot close a losing trade (Optimism)
I was tempted to use the word "Dillusion" for this one but felt perhaps that is a little harsh, you know the deal, you enter a trade, you set a 25 pip stop loss, the trade moves the wrong way and you are -20 on the trade, you look at the chart again frantically, and optimistically think "Oh of course ... I should have set the stop loss beyond that resistance level from the year 1967, what was I thinking" and you change your stop loss, making it -35. The price continues to move in the wrong direction, and you either cop a -35 pip loss instead of -20, or you remove your stop loss all together and spend the next week driving everyone nuts asking "will the EUR/USD go up?" to every trader in the chat room.... Some may say, that they removed their stop loss and eventually, their -100 pips turned into +10, so there .. stick that up your jumper ...

What you do when you move a stop loss further away from entry, is completely change the ratio of the trade you entered. What was originally a 2:1 trade, i.e. your potential gain was twice as large as your potential loss, becomes a 1:1 trade, which is just asking for a margin call very quickly.
My advice on this? NEVER NEVER (I think that is pretty clear) move a stop loss further away from your entry, you can move it closer or break even if you wish, as this improves your risk/reward ratio, but never away. Some may say, that they removed their stop loss and eventually, their -100 pips turned into +10, so there .. stick that up your jumper ... the only problem is, that while they waited the week out waiting for the price to turn around (sometimes it never does .. look at the USD/JPY at the moment) they have tied up the entire margin, meaning they are locked out of many many more potentially profitable trades. So while you might end the week at +10, in the meantime other trades cut their losses at -20, entered 15 more trades in the week, and finished +100 for the week and at the same time learnt a hell of a lot more.
You want to close a trade dancing around the neutral zone (Fear)
This one is different, this is when you have a trade at +1, 0 or -1 pips, right around your entry, and it hangs there for quite a while, what do you do? Do you take a really small gain of +1 "just in case" it turns? Personally, and this one is up to you, I say never close a trade around the neutral zone of a trade, the ultimate aim of a trader, is to see a movement before the majority of others, you can then get in early, and when the others have caught up, let them make you money.
If you have spent the time analysing a trade, trust your judgement, if you analysed correctly, you may have got in early and it will take some time for the others to catch up. Don't be fearful of a losing trade, instead trust what you saw in the first place when you placed the trade. Sure there will be times when you end up losing, but if you cut your losses and let profits run, then you will be well in front in the end.... If a trade has moved 1 pip past your target (that you have not automatically set), why close it? ...
So that is it, to summarise:
One last little tip, I personally never manually close a trade when it goes my way, my trades are closed either by my profit target being hit as set, or preferably, because I have moved my stop loss to my target and I am following the trade from their on in. If a trade has moved 1 pip past your target (that you have not automatically set), why close it?, why not move your stop loss to the target point, at which point you the price will either close you at your target as you originally wanted (congratulations, well done, bravo!), or it will continue it's run and you are essentially "playing with the markets money". This exact strategy turned my trade last night on the USD/CAD from a +45 target trade to eventually it being closed out at +93, it won't work all the time but you have nothing to lose if your target is locked in.
Happy trading!
Theory: When to Exit
Theory: Compounding
 Good afternoon all and I hope you are having a great weekend!
It has been a while since posting my last theory article, so let's get back on the bandwagon and talk about the trading and compounding. I think it is most traders dream to be able to escape the rat race, tell your boss where to go (that's if you don't like him/her of course) and let you trading skills lead you on the road to riches. I'm also sure a lot of you would have heard the saying "it takes money to make money" (if I hear it one more time .. arrgg), which to me is kind of deflating, why can't someone with very little money make money? Well pleasingly, for all of you that aren't driving a BMW and spending their weekend on their private yaughts, compounding is most likely a big part of your solution, so let's look at why.
The easiest and most used analogy when describing compounding is the good old snowball, which to me, living in "the sunburnt country", is somewhat foreigh so i'll have to draw on the imagination for this one. In trading, compounding is when you add your previous earnings onto your existing account size and adjust your trade size accordingly. Umm ok let me try to explain.
Let's look at the two trading scenarios, let's say you have opened a mini account with $1000US, this traditionally would let you trade "mini lots" or lots of 10,000 in size, where each pip would equal $1 US approximately (depending on the pair). If you make five "mini lot" trades on the GBP/USD, with each trade earning you 50 pips, you would have your original $1000 plus 5x$50 ... so $1,250 all up (as well as bragging rights for your 5 straight winners of course). This is just like someone packing a tiny snowball, rolling it down the hill five times, and each time you dusting of any excess snow that acumulated from the previous roll before rolling it again. (can you tell i'm struggling with the whole snow thing). Now let's look at the same trades but include compounding in the scenario. Remember compounding is adding the previous winnings to the account and adjusting your lot size according to some rule. So , from the previous example, after trade 1, our account has gone from $1000 to $1050 (50 pips at $1 each pip). A gain of $50 on a $1000 is a return of 5% of your account, so one compounding strategy would be to increase your lot size by the same amount. Now we are trading lot sizes of 10500 (500 is 5% of 10000), so each pip now equals $1.05. This means trade 2, which returns 50 pips now earns you $52.5 instead of $50, moving your account to $1102.50 instead of $1100. In snowball terms, it is like taking that small snowball rolling it down the hill five times, but each time leaving the excess, and just rolling it right back up there to acumulate even more. (gee im glad that snow thing is over with).
... compounding really is a great tool for all those that can't subscribe to "it takes money to make money" ...
Now what we really want to know, what does it mean to the road to riches? Well if you can make let's say a 50% annual return on your account (certainly acheivable), this time in around 17-18 years you will be a millionaire, sipping a cocktail on a beach somewhere in the bahamas (unless you live there, in which case that would kind of be pointless ... anyway). If you can make a 100% annual return then somewhere around 10 years you would make your first million, not bad from $1000US. The beauty of us as traders is we are not restricted to compounding annually, monthly or even weekly as in a traditional savings account or managed investment portfolio, we can actually compound daily, or even trade by trade.
Compounding really is a great tool for all those that can't subscribe to "takes money to make money", and an even better weapon for those that can.
Happy trading!
Theory: What To Trade?

... I can't tell you what to trade as much as the next person, essentially you need to make that decision yourself ...
There are a multitude of currency pairs out there, pick a countries currency, and there will probably be a broker out there trading it, but what we want to look at is the most commonly traded pairs, or the majors as they are refered to. Below is a list of the major currency pairs most commonly offered:
- EUR/USD (Euro/US Dollar)
- GBP/USD (Pound/US Dollar)
- USD/CHF (US Dollar/Swissy)
- USD/JPY (US Dollar/ Yen)
- AUD/USD (Australian Dollar/US Dollar)
- USD/CAD (US Dollar/Canadian)
So what to trade?, if you are a beginner trader, without a tested and trusted system in place, it would be best to choose a couple of these pairs only. More than 2 or 3 will more than likely confuse the buggery out of you, and the last thing we need is to trade confused (I live my life confused, so I would rather not trade that way ;)).
The GBP/USD (known as the "cable") is very popular amongst traders as it tends to have the highest daily range, giving up more pips in it's moves than any other on average. The EUR/USD is also popular as it tends to have the smallest spread with most brokers, why the USD/CHF is another that has some substantial movements.
... as you trade you will start to notice the relationship between the different majors ...
Quite often which pairs you choose might be to do with when you trade. If you tend to trade the asian session the most, the pairs that include asian or oceania currencies would be a good choice such as the USD/JPY, AUS/USD or even, while not a major, the NZD/USD. Those trading the european session of course might choose teh EUR/USD or the GBP/USD, which just about all the majors are ok to trade during the US session.
As you trade you will start to notice the relationship between the different majors, such as how the EUR/USD and GBP/USD tend to mimmick each other, and that if the EUR/USD is going down, then more than likely the USD/CHF is going up. This of course is because they both have the USD as part of their pairing, so if the USD is getting stronger, the EUR/USD will be moving down (Euro getting weaker against a strengthening USD) and the USD/CHF moving up (USD strengthening against the Swissy).
The only exceptions to this relationship will be when country specific news is released, such as a good economic meter reading in switzerland might move the USD/CHF but not the GBP/USD and so forth.
Whichever you choose, there is money to made and lost just as quickly, so be sure to keep your money management tight and your head clear.
Happy trading! Read More ..
Theory: ADX
The ADX was developed by J. Welles Wilder, yep the same guy who developed the Parabolic and RSI indicators, clever chap that Wilder. Interestingly, Wilder considered the ADX to be his best achievement in terms of indicators, and considering the widespread use of RSI and Parabolics, makes you wonder why more aren't using the ADX (although I am sure plenty are, I have after all only surveyed my next door neighbour and my dog).
First of all let's have a look at what it looks like: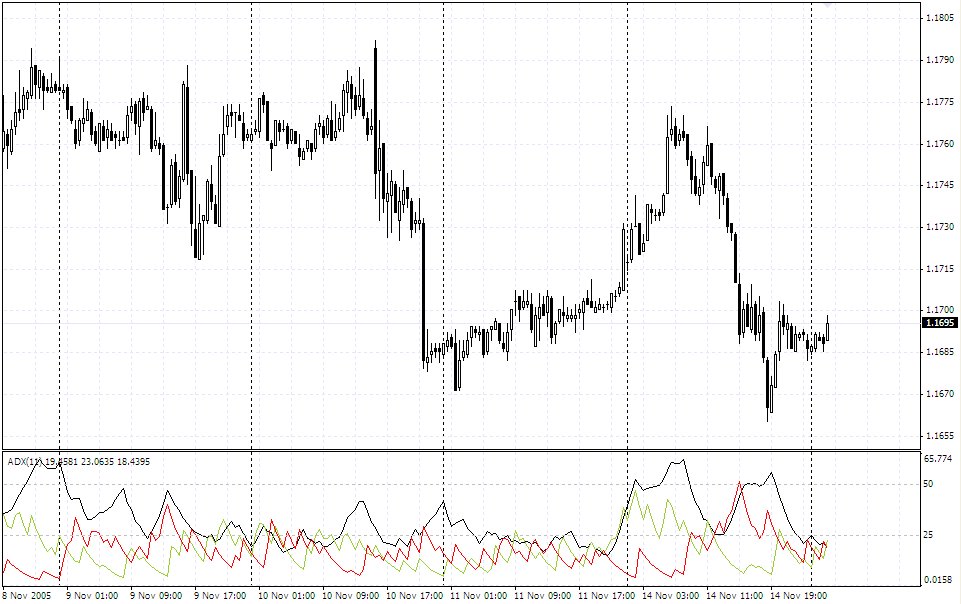 At first it looks all a little like last night's spaghetti, but really it is quite simple. There are three lines, a trend following line, a positive directional line (+DI) and a negative directional line (-DI). In laymans terms, the black line tracks trends, the red line is a signal line to go short, and the green line a signal line to go long.
First the theoretical way to use it. When the red (-DI) line crosses above the green (+DI) line, it is a signal to go short, and vise versa, green above red is a signal to go long (yep just like Moving Average crossovers). Like all indicators though, there is always lag, and as such I pay little attention to these lines and prefer to get my direction signals of the price action itself. The black line though is something different, it is a line that indicates if a trend is in place. If it rises from below 20 (I use 25) to above 20, it is a sign that a trend is developing and to stick with the trade. While the black line rises, I will always stay with a trade unless there is some news announcement coming up that I am worried about. Once the black line ticks down from above 25, it is a signal for you to assess your position as the run may have come to an end for now.
While such a simple technique (I am all about simplicity), you will be surprised how well it will keep you in those strong moves. So that is it, pretty easy huh ... any questions, just throw me an email or comment here.
Best of luck with it.
Happy trading!
Theory: Candlesticks
Hi all, today I'll have a quick chat on the theory of Japanese Candlesticks. In case you did not realise, there are three main ways to view a trading chart, you can view it as a line chart, a bar chart, or a candlestick chart. Below are what each of these look like:
Candlestick's were first introduced in the 1600's, strangely enough to analyze the price of rice contracts. There is no special calculation, they are simply an alternative way of representing current prices. Below is the basic rundown of what a single candlestick looks like, and how it is interpreted. This is a candlestick you would see most often in a downtrend, with the black body being a sign that the closing price finished lower than the opening price.
Here you can see labelled the opening, closing, high and low of the particular period that this candle is representing, which could be 5 minutes, 1 hour or 1 day depending on what chart you are looking at.
Some charts have candles that represent this scenario coloured in red, either way, the main thing is to remember that usually this type of candle will usually be filled.
So that is what a "down" candle looks like, a candle representing the opposite scenario, i.e. when the closing price finishes above the opening price usually is white, or uncoloured and looks like below: You can see that the main difference between this candle and the above candle is that the closing price is above the opening price, indicating that during this period, the price went up during this period.
Some charting packages will show this candle as a green candle, some as white, or some with no colour at all, just an outline. If you set the colour scheme yourself, just recognise that you need to make this candle different to the above candle so you can distinguish the difference.
Now if I was to run through every type of candle that existed in the theory of candlestick charts, I would more than likely get cramp and brain freeze, and not finish this article. So instead, I will run through some basic deduction you can take from interpreting a few different types of candles. Have a look at this candle (called an inverse hammer), you can see the main difference between this candle and the basic candle I showed you above is the lack of a thin line below body (the thicker white area) of the candle. So what does this mean? The thin lines are refered to as "wicks" or "shadows", and represent when prices move up or down, but are then dragged back.
How to read this candle? Well here the price closed well above it's opening price, there was a push for higher prices as represented by the upper wick, which was pulled back slightly. Depending on the market, you may read this as a sign that price will continue with the upward push, as the price didn't retract too far, and there was no real push for lower prices. Ok here is another (called a hammer), the inverse of the previous candle, here you can see the closing price was lower than the opening price, hence the black body of the candle. It has a medium length wick also, which again is a sign that there was a move to push the prices lower. You make this candle to be a sign of strength in a down move, or a sign of a reversal, or pause in an uptrend.
To me the wicks are just as important as the bodies of candles, and should be taken into as much consideration as the colour and length of the body. Now there are a bucket load of different candle types as I mention earlier, but to give you an idea, here are a few that I find to be the most telling when reading candlestick charts. This candle is referred to as a "doji", and you can see has very little, or in this case no body to it. This candle is a sign of indicision in the market, as the wicks above and below the non existant body reflect that there was a push up, and a push down, resulting in a stalemate with the opening price and the closing price being the same in the end.
This candle, a hammer, is a strong sign if seen at the bottom of a downtrend, when you suspect that a currency may be oversold. Here you can see a very long bottom wick in comparison to it's body, and tells the story that prices made a strong move down, but was dragged back above it's opening price, hence the white body. A candle with such a long wick as this, is usually a good sign that the momentum of a downward move is stalling or reversing. Here you can see a variation on the inverse hammer candle I showed you previously, with the main difference being that this one having a much longer upper wick, and the closing price finished below the opening price. This candle can quite often be a sign of a change in momentum, as the strong push to higher prices, as shown by the long upper wick, was pulled back so far that the prices closed lower, a sign that future pushes to higher prices may be rejected. This candle is especially valid in an uptrend where you may suspect that a currency is overbought.
There are so many more, and I haven't even touched on combining these candles into different formations. I have however, provided a link to an e-book on this subject that covers all the basics in a text book fashion that can be a good reference for you all.
Please do not take this candles as given, like any other indicator, they are just guides that can help you, but it is always safe to look for confirmation either in the next candle or with other indicators. Oh and one last tip, never trade on an incomplete candle, always wait for that period to end before assuming the candle is a certain type. Quite often the biggest moves are at the end of the period you are looking at, and what you thought was one type of candle become something completely different in the matter of seconds.
Best of luck with them, I personally feel candles tell you much more than a line graph ever could, and while bar charts can tell you the same information, I find candlesticks much easier, and more importantly, much faster to read. Please leave a comment if there is something vital I have missed.
Happy trading!
Find It
You Say Too Dot Com